IntroductionWhile the Team- or Premium-editions of Visual Studio contain a profiler, users of e.g. the professional edition are lacking such a feature. In this article, I present a method for profiling C++-applications with freely available tools and a simple application for presenting the results in an informative view. Of course the resulting solution will not be as comfortable as an integrated profiler, but if you use profiling only when you find bottlenecks, this method is certainly sufficient - and €5.000 cheaper.The following method was tested with Visual Studio 2008 Professional and Visual C++ 2010 Express. The MethodThe method consists of four steps
Generate a special "/PROFILE" build using Visual Studio (all editions can do this)
Profile the freshly compiled application with the freely available MS tool "VSPerfCmd"
Convert the resulting .vsp-file to .csv-files using "VSPerfReport"
Analyze the resulting - huge - csv-files with the attached Profile Result Viewer.
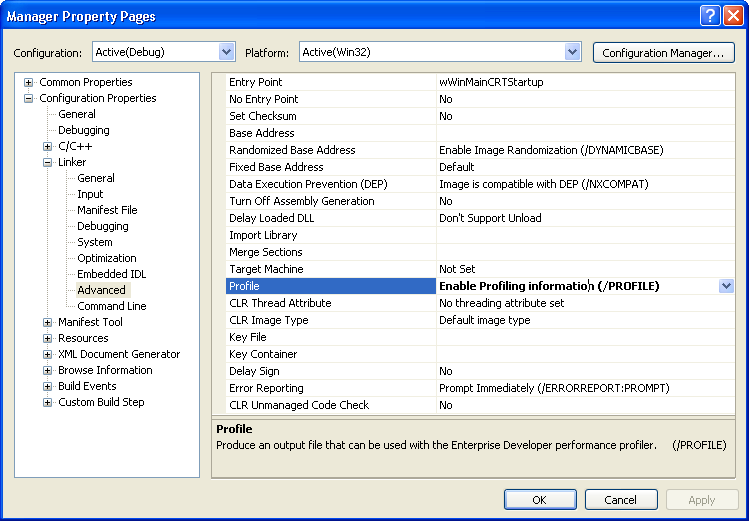
Generate a /PROFILE-buildNote: the following steps should of course be done with a release build and with debugging symbols enabled. In Visual Studio 2008, go to the solution explorer, select the project and open the properties page.
In the section "Configuration Properties" choose "Linker" - "Advanced".
Set "Profile" to "Enable Profiling information (/PROFILE)" (the exact steps for other versions of Visual Studio might differ).


0 comments:
Post a Comment