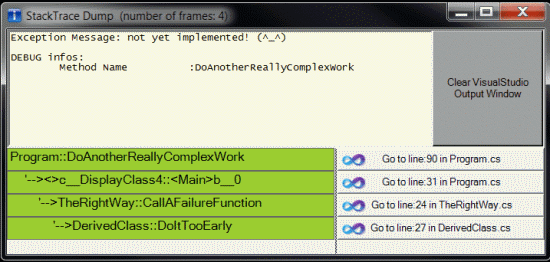
IntroductionFirst of all, what is a stack trace? During the execution of a program, it's usual to have functions or methods which call other functions and/or methods; these, in turn, call other functions and/or methods so that we have a chain of calls. StackTrace is a structure reporting this sequence of calls in the right order they occurred. As stated by the MSDN: "Stack trace information will be most informative with Debug build configurations. By default, Debug builds include debug symbols, while Release builds do not. The debug symbols contain most of the file, method name, line number, and column information used in constructing StackFrame and StackTrace objects." Now the question is how to use these information? Very often, during debugging or in short cycle development, I struggle with Exceptions threw by very deep code; in cases like that, what I can do is: navigate from call to call diving into the code until the source of the thrown exception is reached... another possibility is read the call stack and see the line of code that threw the exception. The class StackTrace lists the sequence of function/method calls, so the main idea is use this list of calls to make some sort of automation for navigating through the source code.
Using the codeThe core is the .NET StackTrace class. If you create an instance of the class in any point of your code (see the snippet of code below), you can inspect the chain of calls that bring you to that point of your code! using System.Diagnostics;
. . .
StackTrace stacktrace = new StackTrace();
StackFrame[] frames = stacktrace.GetFrames();
string stackName = string.Empty;
foreach (StackFrame sf in frames){
System.Reflection.MethodBase method = sf.GetMethod();
stackName += (method.Name+"|");
}//end_foreach
Read more: Codeproject
QR:


1 comments:
You need to take part in a contest for one of the highest quality blogs
online. I'm going to recommend this website!
Also visit my web blog :: basal metabolic rate calculator
My web site - bmr calculator for women
Post a Comment