Debugging WCF services from the client through to the service is much easier when attaching the debugger to either the service or both the client and the service.In the past, I have debugged services by firing up the client application and manually attaching to the WCF Service Host – which in this case is the ASP.NET worker process. This process is quite cumbersome. Visual Studio has feature that supports attaching to multiple projects when starting up. In this example, I have a WCF service hosted in IIS which lives in the Wcf.Demo.IisServiceHost project. I also have a Wcf.Demo.TestHarness project which calls the service. I want to be able to attach the debugger to both the client and service by simply pressing F5. Steps
1. Right click on the solution and select “Set StartUp Projects…“.
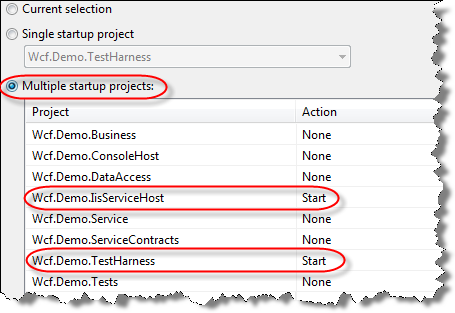
2. In the StartUp tab, select “Multiple startup projects” and select the projects you want to start up. 
3. On the Action of the selected projects, select “Start” to start with the debugger attached.
If you now run (F5) the application, it will fire up both the Test Harness and a Internet browser to the service virtual directory. You can disable this.4. Go to the Web project properties for the WCF web project and select “Don’t open a page“.
Now when you hit F5, the test harness will launch and the debugger will be attached to both processes.Read more: Dave Jansen’s Blog
1. Right click on the solution and select “Set StartUp Projects…“.
2. In the StartUp tab, select “Multiple startup projects” and select the projects you want to start up.

3. On the Action of the selected projects, select “Start” to start with the debugger attached.
If you now run (F5) the application, it will fire up both the Test Harness and a Internet browser to the service virtual directory. You can disable this.4. Go to the Web project properties for the WCF web project and select “Don’t open a page“.
Now when you hit F5, the test harness will launch and the debugger will be attached to both processes.Read more: Dave Jansen’s Blog


0 comments:
Post a Comment