With VS 11 Developer Preview we have invested tremendously in parallel debugging for both CPU (managed and native) and GPU debugging. I'll be doing a whole bunch of blog posts on those topics, and in this post I just wanted to get people started with GPU debugging, i.e. with debugging C++ AMP code. First I invite you to watch 6 minutes of a glimpse of the C++ AMP debugging experience though this video (ffw to minute 51:54, up until minute 59:16). Don't read the rest of this post, just go watch that video, ideally download the High Quality WMV.
SummaryGPU debugging essentially means debugging the lambda that you pass to the parallel_for_each call (plus any functions you call from the lambda, of course). CPU debugging means debugging all the code above and below the parallel_for_each call, i.e. all the code except the restrict(direct3d) lambda and the functions that it calls. With VS 11 you have to choose what debugger you want to use for a particular debugging session, CPU or GPU. So you can place breakpoints all over your code, then choose what debugger you want (CPU or GPU), and you'll only be able to hit breakpoints for the code type that the debugger engine understands – the remaining breakpoints will appear as unbound. If you want to hit the unbound breakpoints, you'd have to stop debugging, and start again with the other debugger. Sorry. We suck. We know. But once you are past that limitation, I think you'll find the experience truly rewarding – seriously!
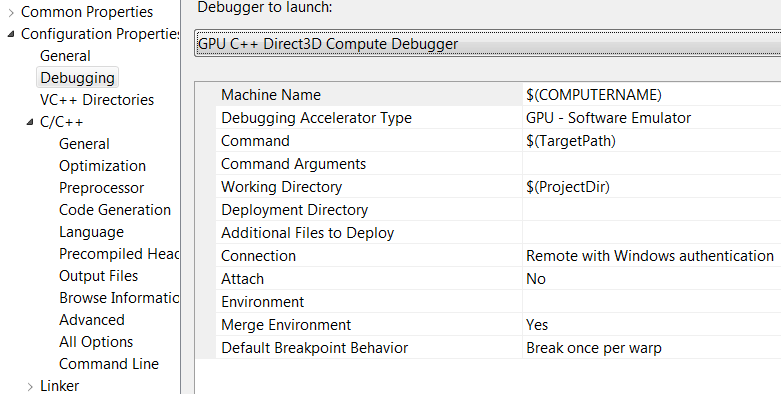
Switching debugger enginesWith the Developer Preview bits, one way to switch the debugger engine is through the project properties – see the screenshots that follow.Read more: The Moth
QR:


0 comments:
Post a Comment